Network Models of Structure, Dynamics and Function of the Neocortex
Emergence of Orientation Selectivity in Rodent Primary Visual Cortex
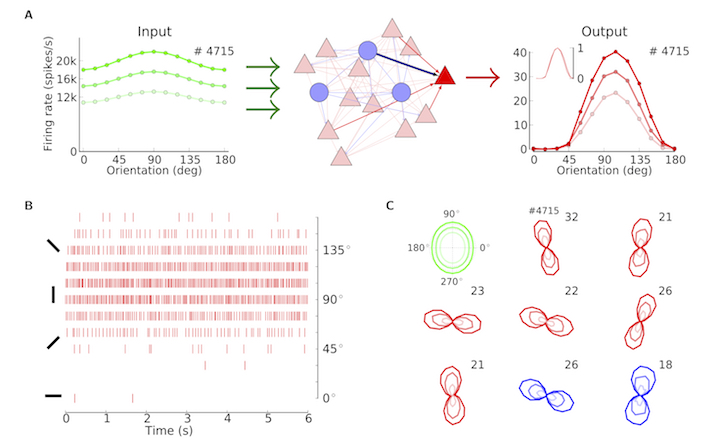
Most neurons in the primary visual cortex of mammals are tuned for the orientation of a stimulus. Whereas many species exhibit orderly feature maps in the cortex, the networks of rodents are less organized. But how do tuning curves emerge in rodents, and why are they contrast invariant? To study this question, we developed a generic network model of sensory processing, which emphasizes the contribution of recurrent inhibition. In this model, contrast-invariant tuning curves arise through selective attenuation of the non-informative component of feedforward thalamic input, which conveys a weak orientation bias. In recent work, we also explored how the statistics and geometry of thalamo-cortical projections may contribute to establish this initial bias. Furthermore, we dissected the distributed signal flow in a layered model of neocortex and explain layer-specific tuning properties in terms of synaptic connectivity, and extended our modeling framework to cover color vision in dichromats and trichromats.
Hebbian and Homeostatic Plasticity in Neocortical Networks
Feature-specific connectivity in the visual cortex of mice emerges only after some weeks of visual experience. We asked which synaptic plasticity rule can possibly explain this phenomenon. In computer simulations, we found that both functional and structural plasticity can lead to a connectivity bias between neurons with similar tuning curves, provided the learning rule has additional self-regulating (homeostatic) properties. Next to voltage-based spike timing-dependent plasticity, we considered a form of structural plasticity, which is only driven by a homeostatic control of firing rate. Homeostatic plasticity, unlike most forms of Hebbian plasticity, does not explicitly refer to the correlation in neuronal activity. It turned out that this rule nevertheless exhibits Hebbian properties implicitly, which explains why feature-specific connectivity emerges after exposure to visual input. In a recent project, we developed the idea that network remodeling can also be induced by transcranial electric stimulation that drives neurons away from their structural equilibrium.
Recurrent Network Dynamics: Pairwise and Higher-order Correlations
The mesh of synaptic connections in a network like the neocortex is dense and dominated by recurrent loops. It is not obvious how such complex circuitry affects the signal processing and activity dynamics of a network. We operationalized the problem by asking to which degree neuronal connectivity induces pairwise correlations between neurons, but also correlations of higher order. The explicit mathematical answers we found involved stochastic point process models (Hawkes processes), a combination of graph theory and matrix algebra, but also approximation techniques known from statistical physics (Fokker-Planck theory). We plan to exploit these results and extend our methods to gain new insight into non-linear network dynamics and correlation-based synaptic plasticity in recurrent networks.
The Inverse Problem: Inference of Network Structure from Correlations
Some dynamic network models allow to derive explicit relations between network structure (connectivity matrix) and correlations of activity (covariance matrix). But do such relations also imply solutions of the inverse problem? It is clear that different networks can induce the same correlation structure. However, we found a way to disambiguate the relation and actually solve the inverse problem in the case of sparse networks. The new algorithm could be successfully applied to networks of spiking neurons, but also to large scale networks of brain areas, the activity of which is observed in whole-brain fMRI scans of the human brain.
Figure
A generic network model of primary visual cortex. A: Emergence of contrast-invariant tuning curves by selective attenuation of the non-informative component of thalamic input. B: Simulation of a model network with strong inhibition. Response of sample neurons upon oriented stimulation. C: Sample tuning curves. The weak tuning of thalamic input (green) is amplified by the network, leading to strong and contrast-invariant tuning of excitatory (red) and inhibitory (blue) neurons. (Figure taken from Sadeh et al, SpringerPlus, 2014)


